This analysis looks at consumer debt deferrals by lender group. The data is from the credit rating agency Equifax Canada, and is as reported to that agency.1 For residential mortgages, the data covers approximately 80% to 85% of the Canadian market and includes both insured and uninsured mortgages.
Highlight of findings
- Mortgage deferrals accounted for 86% of consumer debt deferred as at June 30, 2020.
- The share of outstanding debt in deferral varied by lender group. When compared to other lender groups, the Big 6 banks2 had allowed the deferral of the most debt.
- For all lender groups, the percentage of mortgage balance in deferral was higher in Alberta than in other provinces and territories.
- As at December 31, 2020, total mortgage balance in deferral had decreased by 79% from June of the same year. Total non-mortgage consumer debt balance in deferral had decreased by 88%.
We first focus on the period up to June 2020, when the unemployment rate had peaked since the beginning of the COVID-19 pandemic. We then provide the most recent information available at the time of this publication. We present the statistics for both mortgage and non-mortgage consumer debt but we do not draw a comparison between the 2 market segments.
Share of consumer debt balances in deferral by lender group
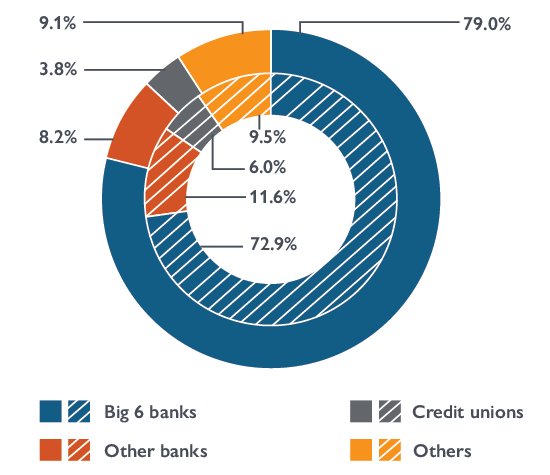
As at June 30, 2020, 16.7% of the outstanding mortgage balance in Canada was in deferral.3 The average balance (per loan) of deferred mortgages was $270,597, compared to the average balance of $219,077 for all outstanding mortgages. The Big 6 banks4 had a market share of 72.9% of the residential mortgage market. They held 79.0% of the total mortgage balance in deferral. Other banks and the credit unions carried 12.0% of the mortgage balance in deferral. The remaining 9.0% was held by other lenders.5
The non-mortgage consumer debt market is smaller than the mortgage market in terms of outstanding balances. As of June 30, 2020, the:
- outstanding balance of non-mortgage consumer debt was 46.5% that of mortgage debt
- non-mortgage consumer debt,6 5.7% of the total outstanding balance was in deferral
- balance of non-mortgage consumer debt in deferral was 15.9% that of mortgage debt in deferral
Of the balance of non-mortgage consumer debt in deferral, 84.2% was with the Big 6 banks, 6.6% at other banks and credit unions, and 9.2% at other lenders.
Figure 1: Share of consumer debt balances in deferral by lender group
Mortgage Debt
Non-Mortgage Debt
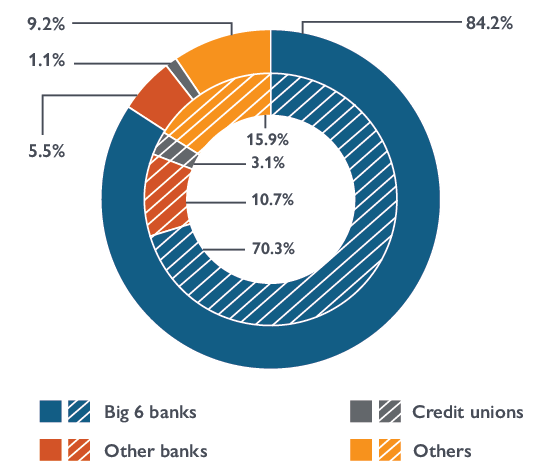
Outer circle: Balance in deferral for a lender group divided by the total balance in deferral.
Inner circle: Market share, calculated as outstanding balance for a lender group divided by the total outstanding balance.
Source: CMHC calculations using Equifax data
| Lender group | Share in deferral (Mortgage) |
Share in deferral (Non-mortgage) |
Market share (Mortgage) |
Market share (Non-mortgage) |
|---|---|---|---|---|
| Big 6 banks | 79.0% | 84.2% | 72.9% | 70.3% |
| Other banks | 8.2% | 5.5% | 11.6% | 10.7% |
| Credit unions | 3.8% | 1.1% | 6.0% | 3.1% |
| Others | 9.1% | 9.2% | 9.5% | 15.9% |
| Overall | 100.0% | 100.0% | 100.0% | 100.0% |
Source: CMHC calculations using Equifax data
Balance in deferral as a share of total balance held by each lender group
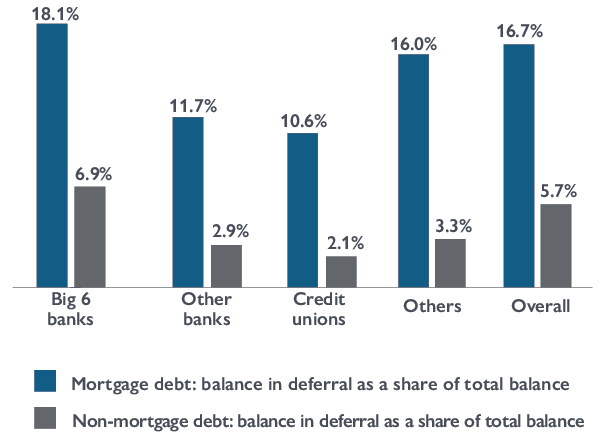
Balances in deferral as a share of total balances varied across lender groups for mortgages. For the Big 6 banks, 18.1% of the outstanding mortgage balance was in deferral as at June 30, 2020. The percentage was lower at other banks (11.7%), credit unions (10.6%) and other lenders (16.0%).
A smaller proportion of non-mortgage consumer debt was deferred. For the Big 6 banks, 6.9% of the balance of non-mortgage debt was in deferral. The percentage was again lower at other banks (2.9%), credit unions (2.1%) and other lenders (3.3%).
Figure 2: Balance in deferral as a share of total balance of consumer debt held by each lender group
Source: CMHC calculations using Equifax data
| Lender Group | Mortgage | Non-Mortgage |
|---|---|---|
| Big 6 banks | 18.1% | 6.9% |
| Other banks | 11.7% | 2.9% |
| Credit unions | 10.6% | 2.1% |
| Others | 16.0% | 3.3% |
| Overall | 16.7% | 5.7% |
Source: CMHC calculations using Equifax data
Consumer debt deferrals by province and territory
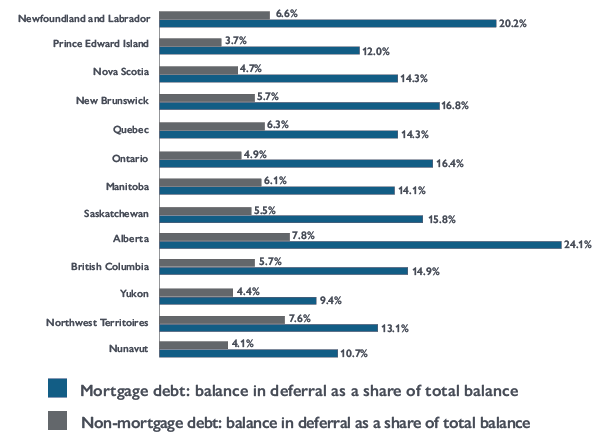
The balance of consumer debt in deferral as a share of the total balance was higher in Alberta than in the other provinces and territories. As shown in figure 3, 24.1% of the outstanding mortgage balance in Alberta was deferred as at June 30, 2020, followed by Newfoundland and Labrador (20.2%) and New Brunswick (16.8%). For non-mortgage consumer debt, 7.8% of the outstanding balance in Alberta was deferred, followed by the Northwest Territories (7.6%) and Newfoundland and Labrador (6.6%).
Figure 3: Balance in deferral as a share of total balance of consumer debt, provinces and territories
Source: CMHC calculations using Equifax data
| Geography | Mortgage | Non-Mortgage |
|---|---|---|
| Newfoundland and Labrador | 20.2% | 6.6% |
| Prince Edward Island | 12.0% | 3.7% |
| Nova Scotia | 14.3% | 4.7% |
| New Brunswick | 16.8% | 5.7% |
| Quebec | 14.3% | 6.3% |
| Ontario | 16.4% | 4.9% |
| Manitoba | 14.1% | 6.1% |
| Saskatchewan | 15.8% | 5.5% |
| Alberta | 24.1% | 7.8% |
| British Columbia | 14.9% | 5.7% |
| Yukon | 9.4% | 4.4% |
| Northwest Territories | 13.1% | 7.6% |
| Nunavut | 10.7% | 4.1% |
Source: CMHC calculations using Equifax data
Consumer debt deferrals by lender group in provinces and territories
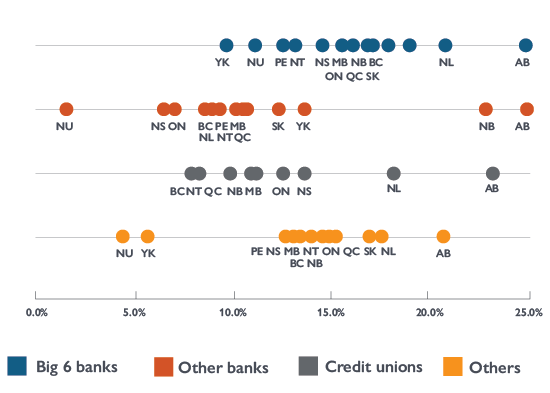
Looking at each of the lender groups (figure 4), the share of the outstanding mortgage balance that was deferred was higher in Alberta than in the other provinces and territories:
- Among the Big 6 banks, 24.8% of the outstanding mortgage balance in Alberta was deferred. The figure was 20.7% in Newfoundland and Labrador, 9.6% in Yukon, and between 10% and 20% in the other provinces and territories.
- Across the other banks, the share of the outstanding mortgage balance that was in deferral was 24.9% in Alberta and 22.8% in New Brunswick. This was higher than in the rest of the country.
- Among credit unions, 23.2% of the mortgage balance in Alberta was deferred, followed by 18.1% in Newfoundland and Labrador.
Figure 4: Mortgage balance in deferral as a share of total mortgage balance
Source: CMHC calculations using Equifax data
| Geography | Big 6 Banks | Other Banks | Credit Unions | Others |
|---|---|---|---|---|
| Newfoundland and Labrador | 20.7% | 10.2% | 18.1% | 17.5% |
| Prince Edward Island | 12.5% | 8.6% | n/a * | 12.8% |
| Nova Scotia | 14.6% | 6.6% | 13.6% | 13.1% |
| New Brunswick | 16.1% | 22.8% | 11.1% | 15.1% |
| Quebec | 17.8% | 10.5% | 9.8% | 14.9% |
| Ontario | 17.2% | 7.0% | 12.5% | 14.5% |
| Manitoba | 15.7% | 9.1% | 10.9% | 13.4% |
| Saskatchewan | 19.0% | 12.3% | n/a * | 16.9% |
| Alberta | 24.8% | 24.9% | 23.2% | 20.7% |
| British Columbia | 16.9% | 8.5% | 8.0% | 15.1% |
| Yukon | 9.6% | 13.6% | n/a * | 5.7% |
| Northwest Territories | 13.1% | 10.3% | 8.2% | 13.9% |
| Nunavut | 11.1% | 1.6% | n/a * | 4.4% |
* The numbers shown as “n/a” in the table were suppressed. For Prince Edward Island, according to data provided by the Credit Union Deposit Insurance Corporation Prince Edward Island, 6.5% of personal and commercial borrowings (in terms of the number of accounts) were in deferral as at June 30, 2020.
Source: CMHC calculations using Equifax data
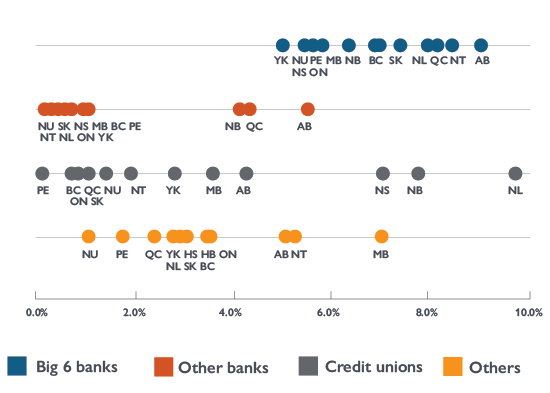
The balance of non-mortgage consumer debt in deferral held by each lender group also varied across the provinces and territories (figure 5):
- Among the Big 6 banks, the share of the balance that was in deferral was in the range of 5% to 9% across the provinces and territories.
- Less than 1% of non-mortgage consumer debt held at the other banks was deferred in all provinces and territories other than Alberta, New Brunswick and Quebec.
- For credit unions, 9.7% of non-mortgage consumer debt in Newfoundland and Labrador was deferred, 7.7% in New Brunswick and 7.1% in Nova Scotia. The number was lower than 5% for the other provinces and territories.
Figure 5: Balance of non-mortgage consumer debt in deferral as a share of total balance of non-consumer debt
Source: CMHC calculations using Equifax data
| Geography | Big 6 Banks | Other Banks | Credit Unions | Others |
|---|---|---|---|---|
| Newfoundland and Labrador | 8.0% | 0.5% | 9.7% | 3.1% |
| Prince Edward Island | 5.5% | 0.4% | 0.1% | 1.8% |
| Nova Scotia | 5.7% | 0.2% | 7.1% | 2.8% |
| New Brunswick | 6.9% | 4.1% | 7.7% | 2.9% |
| Quebec | 8.1% | 4.3% | 0.9% | 2.4% |
| Ontario | 5.8% | 0.8% | 1.1% | 2.9% |
| Manitoba | 6.4% | 0.3% | 3.6% | 7.1% |
| Saskatchewan | 7.4% | 0.2% | 1.4% | 3.5% |
| Alberta | 9.0% | 5.5% | 4.3% | 5.1% |
| British Columbia | 7.0% | 0.3% | 0.7% | 3.5% |
| Yukon | 5.0% | 0.9% | 2.8% | 2.4% |
| Northwest Territories | 8.4% | 0.4% | 1.9% | 5.3% |
| Nunavut | 5.0% | 0.2% | 1.0% | 1.1% |
Source: CMHC calculations using Equifax data
Active deferrals at the end of December 2020
By the end of December 2020, the total mortgage balance in deferral had decreased by 79% from June 2020. The total balance of non-mortgage consumer debt in deferral, meanwhile, had decreased by 88%.
Footnotes
- This report uses data from the credit rating agency Equifax Canada on mortgage and non-mortgage consumer debt. For mortgages, the data covers approximately 80% to 85% of the Canadian market. CMHC did not access or receive personal identifiable information on individuals in producing the report. All figures are sourced from Equifax Canada unless otherwise stated. Unless otherwise noted, dollars are not adjusted for inflation. Equifax data is as is reported to the Bureau. The data may be revised at a later date due to Equifax data updates.
- The Big 6 banks include: Canadian Imperial Bank of Commerce (CIBC), Royal Bank of Canada (RBC), Bank of Nova Scotia, Toronto-Dominion (TD), Bank of Montreal (BMO) and National Bank of Canada.
- In terms of the number of outstanding loans, 13.5% of the outstanding loans were in deferral as at June 30, 2020.
- In Equifax data, the Big 6 banks include Canadian Imperial Bank of Commerce (CIBC), Royal Bank of Canada (RBC), Bank of Nova Scotia, Toronto-Dominion (TD), Bank of Montreal (BMO) and National Bank of Canada.
- In Equifax data, the “other” group includes Other Monolines, Personal Finance Companies, Sales Finance Companies and all other financial service companies not already captured.
- This includes credit cards, auto loans, lines of credit and other consumer debt.



 Share via Email
