


 Share via Email
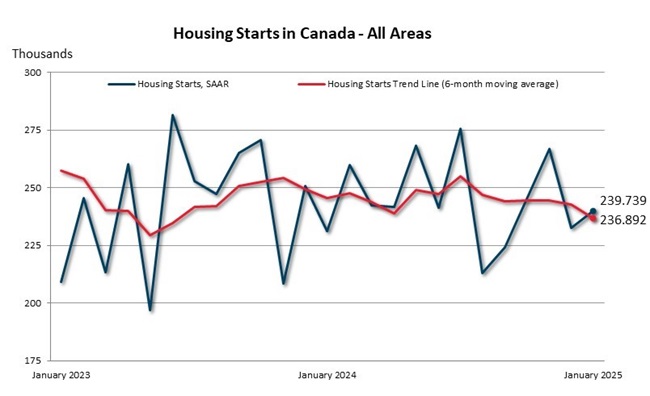
The six-month trend in housing starts declined 2.5% in January to 236,892 units, according to Canada Mortgage and Housing Corporation (CMHC). The trend measure is a six-month moving average of the seasonally adjusted annual rate (SAAR) of total housing starts for all areas in Canada.
The total monthly SAAR of housing starts for all areas in Canada increased 3% in January (239,739 units) compared to December (232,492 units).
Actual housing starts were up 7% year-over-year in centres with a population of 10,000 or greater, with 15,930 units recorded in January 2025, compared to 14,883 in January 2024.
Quote:
“Both the monthly SAAR and actual housing starts increased in Canada’s urban centres in January. This was primarily driven by an 8% increase in multi-unit starts, particularly purpose-built rentals concentrated in Quebec and British Columbia. While these increases show early signs of progress to begin the year, foreign trade risks add significant uncertainty for housing construction going forward,” said Tania Bourassa-Ochoa, CMHC’s Deputy Chief Economist. “In our recently released Housing Market Outlook, CMHC projected housing starts to slow down from 2025 to 2027, mainly due to decreases in condominium apartment starts.”
Key facts:
- The monthly SAAR for Canada’s centres with a population of 10,000 or greater also increased 3% in January (220,643 units) compared to December (215,052 units).
- The rural starts monthly SAAR estimate was 19,096 units.
- Among Canada’s three largest cities, Montreal posted a 112% year-over-year increase in actual housing starts in January while Vancouver recorded a 37% increase, both driven by higher multi-unit starts. Starts in Toronto fell 41% from January 2024, driven by decreases in multi-unit starts.
- Monthly Housing Starts and Other Construction Data are accessible in English and French on our website and the CMHC Housing Market Information Portal.
- Housing starts data is available on the 11th business day each month. February housing starts data will be released on March 17 at 8:15 AM ET.
- CMHC uses the trend measure as a complement to the monthly SAAR of housing starts to account for considerable swings in monthly estimates and to obtain a clearer picture of upcoming new housing supply. In some situations, analyzing only SAAR data can be misleading, as the multi-unit segment largely drives the market and can vary significantly from one month to the next.
- Definitions and methodology to better understand the foundations of the Starts and Completions and Market Absorption surveys.
Housing starts facilitate the analysis of monthly, quarterly, and year-over-year activity in the new home market. The data we collect as part of our Starts and Completions and Market Absorption surveys helps us obtain a clearer picture of upcoming new housing supply and is used as part of our various housing reports.
CMHC plays a critical role as a national convenor to promote stability and sustainability in Canada’s housing finance system. Our mortgage insurance products support access to home ownership and the creation and maintenance of rental supply. We actively support the Government of Canada in delivering on its commitment to make housing more affordable. Our research and data help inform housing policy. By facilitating cooperation between all levels of government, private and non-profit sectors, we contribute to advancing housing affordability, equity, and climate compatibility.
Follow us on X (formerly Twitter), YouTube, LinkedIn, Facebook and Instagram.
Related links:
- Housing starts for December 2024
- 2025 Housing Market Outlook
- 2024 Rental Market Report
- High housing costs making it harder to move for jobs many are seeking
- Higher rates hindered housing starts in 2023
- Canada’s potential capacity for housing construction
Information on this release:
To request an interview with a CMHC economist, contact:
Media Relations, CMHC
media@cmhc-schl.gc.ca
| Single-Detached | All Others | Total | |||||||
|---|---|---|---|---|---|---|---|---|---|
| Jan. 2024 | Jan. 2025 | % | Jan. 2024 | Jan. 2025 | % | Jan. 2024 | Jan. 2025 | % | |
| N.-L. | 38 | 33 | -13 | 36 | 23 | -36 | 74 | 56 | -24 |
| P.E.I. | 17 | 11 | -35 | 67 | 188 | 181 | 84 | 199 | 137 |
| N.S. | 104 | 114 | 10 | 351 | 516 | 47 | 455 | 630 | 38 |
| N.B. | 28 | 30 | 7 | 215 | 48 | -78 | 243 | 78 | -68 |
| Atlantic | 187 | 188 | 1 | 669 | 775 | 16 | 856 | 963 | 13 |
| Qc | 237 | 256 | 8 | 2,347 | 3,749 | 60 | 2,584 | 4,005 | 55 |
| Ont. | 661 | 495 | -25 | 5,073 | 3,575 | -30 | 5,734 | 4,070 | -29 |
| Man. | 110 | 145 | 32 | 191 | 251 | 31 | 301 | 396 | 32 |
| Sask. | 60 | 59 | -2 | 157 | 139 | -11 | 217 | 198 | -9 |
| Alta. | 815 | 979 | 20 | 2,114 | 2,220 | 5 | 2,929 | 3,199 | 9 |
| Prairies | 985 | 1,183 | 20 | 2,462 | 2,610 | 6 | 3,447 | 3,793 | 10 |
| B.C. | 260 | 264 | 2 | 2,002 | 2,835 | 42 | 2,262 | 3,099 | 37 |
| Canada (10,000+) | 2,330 | 2,386 | 2 | 12,553 | 13,544 | 8 | 14,883 | 15,930 | 7 |
Data for 2022 based on 2016 Census Definitions and data for 2023, 2024 and 2025 based on 2021 Census Definitions.
Source: CMHC Starts and Completion Survey, Market Absorption Survey
## not calculable / extreme value
| Single-Detached | All Others | Total | |||||||
|---|---|---|---|---|---|---|---|---|---|
| Jan. 2024 | Jan. 2025 | % | Jan. 2024 | Jan. 2025 | % | Jan. 2024 | Jan. 2025 | % | |
| Abbotsford-Mission | 16 | 10 | -38 | 78 | 280 | 259 | 94 | 290 | 209 |
| Barrie | 20 | 3 | -85 | 8 | 18 | 125 | 28 | 21 | -25 |
| Belleville - Quinte West | 7 | 6 | -14 | 0 | 0 | - | 7 | 6 | -14 |
| Brantford | 13 | 11 | -15 | 0 | 242 | ## | 13 | 253 | ## |
| Calgary | 487 | 552 | 13 | 1,464 | 1,077 | -26 | 1,951 | 1,629 | -17 |
| Chilliwack | 8 | 10 | 25 | 1 | 4 | 300 | 9 | 14 | 56 |
| Drummondville | 4 | 10 | 150 | 1 | 18 | ## | 5 | 28 | 460 |
| Edmonton | 242 | 332 | 37 | 441 | 879 | 99 | 683 | 1,211 | 77 |
| Fredericton | 8 | 10 | 25 | 7 | 2 | -71 | 15 | 12 | -20 |
| Greater/Grand Sudbury | 0 | 2 | ## | 2 | 0 | -100 | 2 | 2 | - |
| Guelph | 2 | 1 | -50 | 0 | 1 | ## | 2 | 2 | - |
| Halifax | 51 | 60 | 18 | 289 | 451 | 56 | 340 | 511 | 50 |
| Hamilton | 47 | 13 | -72 | 204 | 17 | -92 | 251 | 30 | -88 |
| Kamloops | 1 | 11 | ## | 1 | 8 | ## | 2 | 19 | ## |
| Kelowna | 11 | 17 | 55 | 107 | 343 | 221 | 118 | 360 | 205 |
| Kingston | 9 | 4 | -56 | 2 | 166 | ## | 11 | 170 | ## |
| Kitchener – Cambridge – Waterloo | 14 | 17 | 21 | 167 | 179 | 7 | 181 | 196 | 8 |
| Lethbridge | 15 | 22 | 47 | 88 | 103 | 17 | 103 | 125 | 21 |
| London | 27 | 32 | 19 | 155 | 22 | -86 | 182 | 54 | -70 |
| Moncton | 5 | 8 | 60 | 95 | 8 | -92 | 100 | 16 | -84 |
| Montréal | 63 | 101 | 60 | 1,134 | 2,439 | 115 | 1,197 | 2,540 | 112 |
| Nanaimo | 27 | 4 | -85 | 177 | 0 | -100 | 204 | 4 | -98 |
| Oshawa | 17 | 6 | -65 | 312 | 0 | -100 | 329 | 6 | -98 |
| Ottawa – Gatineau | 93 | 103 | 11 | 308 | 685 | 122 | 401 | 788 | 97 |
| Gatineau | 11 | 12 | 9 | 181 | 310 | 71 | 192 | 322 | 68 |
| Ottawa | 82 | 91 | 11 | 127 | 375 | 195 | 209 | 466 | 123 |
| Peterborough | 5 | 6 | 20 | 0 | 0 | - | 5 | 6 | 20 |
| Québec | 25 | 38 | 52 | 538 | 488 | -9 | 563 | 526 | -7 |
| Red Deer | 5 | 16 | 220 | 6 | 12 | 100 | 11 | 28 | 155 |
| Regina | 5 | 7 | 40 | 110 | 96 | -13 | 115 | 103 | -10 |
| Saguenay | 24 | 9 | -63 | 18 | 48 | 167 | 42 | 57 | 36 |
| St. Catharines – Niagara | 57 | 28 | -51 | 38 | 83 | 118 | 95 | 111 | 17 |
| Saint John | 9 | 7 | -22 | 90 | 26 | -71 | 99 | 33 | -67 |
| St. John's | 34 | 30 | -12 | 36 | 22 | -39 | 70 | 52 | -26 |
| Saskatoon | 51 | 49 | -4 | 46 | 41 | -11 | 97 | 90 | -7 |
| Sherbrooke | 17 | 8 | -53 | 67 | 53 | -21 | 84 | 61 | -27 |
| Thunder Bay | 0 | 3 | ## | 6 | 14 | 133 | 6 | 17 | 183 |
| Toronto | 281 | 219 | -22 | 3,724 | 2,149 | -42 | 4,005 | 2,368 | -41 |
| Trois-Rivières | 9 | 11 | 22 | 88 | 40 | -55 | 97 | 51 | -47 |
| Vancouver | 121 | 141 | 17 | 1,342 | 1,866 | 39 | 1,463 | 2,007 | 37 |
| Victoria | 11 | 15 | 36 | 171 | 90 | -47 | 182 | 105 | -42 |
| Windsor | 11 | 13 | 18 | 196 | 31 | -84 | 207 | 44 | -79 |
| Winnipeg | 99 | 133 | 34 | 171 | 236 | 38 | 270 | 369 | 37 |
| Total | 1,951 | 2,078 | 7 | 11,688 | 12,237 | 5 | 13,639 | 14,315 | 5 |
Data for 2022 based on 2016 Census Definitions and data for 2023, 2024 and 2025 based on 2021 Census Definitions.
Source: CMHC Starts and Completion Survey, Market Absorption Survey
## not calculable / extreme value
| Single-Detached | All Others | Total | |||||||
|---|---|---|---|---|---|---|---|---|---|
| Dec. 2024 | Jan. 2025 | % | Dec. 2024 | Jan. 2025 | % | Dec. 2024 | Jan. 2025 | % | |
| N.L. | 633 | 707 | 12 | 566 | 274 | -52 | 1,199 | 981 | -18 |
| P.E.I. | 294 | 267 | -9 | 984 | 2,256 | 129 | 1,278 | 2,523 | 97 |
| N.S. | 1,700 | 1,872 | 10 | 3,743 | 6,316 | 69 | 5,443 | 8,188 | 50 |
| N.B. | 806 | 964 | 20 | 4,022 | 785 | -80 | 4,828 | 1,749 | -64 |
| Qc | 5,854 | 5,961 | 2 | 35,910 | 52,399 | 46 | 41,764 | 58,360 | 40 |
| Ont. | 12,448 | 9,426 | -24 | 50,988 | 47,571 | -7 | 63,436 | 56,997 | -10 |
| Man. | 1,656 | 2,081 | 26 | 3,228 | 3,012 | -7 | 4,884 | 5,093 | 4 |
| Sask. | 1,508 | 1,289 | -15 | 1,848 | 1,668 | -10 | 3,356 | 2,957 | -12 |
| Alta. | 16,208 | 16,918 | 4 | 27,197 | 27,901 | 3 | 43,405 | 44,819 | 3 |
| B.C. | 4,354 | 4,898 | 12 | 41,105 | 34,078 | -17 | 45,459 | 38,976 | -14 |
| Canada (10,000+) | 45,461 | 44,383 | -2 | 169,591 | 176,260 | 4 | 215,052 | 220,643 | 3 |
| Canada (All Areas) | 57,284 | 57,299 | 0 | 175,207 | 182,443 | 4 | 232,492 | 239,739 | 3 |
Data for 2022 based on 2016 Census Definitions and data for 2023, 2024 and 2025 based on 2021 Census Definitions.
Source: CMHC Starts and Completion Survey, Market Absorption Survey
## not calculable / extreme value
| Single-Detached | All Others | Total | |||||||
|---|---|---|---|---|---|---|---|---|---|
| Dec. 2024 | Jan. 2025 | % | Dec. 2024 | Jan. 2025 | % | Dec. 2024 | Jan. 2025 | % | |
| Abbotsford-Mission | 187 | 193 | 3 | 1,404 | 3,360 | 139 | 1,591 | 3,553 | 123 |
| Barrie | 521 | 73 | -86 | 6,576 | 216 | -97 | 7,097 | 289 | -96 |
| Belleville - Quinte West | 280 | 186 | -34 | 60 | 0 | -100 | 340 | 186 | -45 |
| Brantford | 117 | 198 | 69 | 24 | 2,904 | ## | 141 | 3,102 | ## |
| Calgary | 6,486 | 8,444 | 30 | 14,436 | 12,924 | -10 | 20,922 | 21,368 | 2 |
| Chilliwack | 146 | 152 | 4 | 146 | 48 | -67 | 1,178 | 200 | -83 |
| Drummondville | 244 | 262 | 7 | 624 | 216 | -65 | 868 | 478 | -45 |
| Edmonton | 7,656 | 7,781 | 2 | 10,524 | 10,548 | 0 | 18,180 | 18,329 | 1 |
| Fredericton | 294 | 305 | 4 | 48 | 24 | -50 | 342 | 329 | -4 |
| Greater/Grand Sudbury | 127 | 104 | -18 | 420 | 0 | -100 | 547 | 104 | -81 |
| Guelph | 96 | 21 | -78 | 132 | 12 | -91 | 228 | 33 | -86 |
| Halifax | 749 | 1,030 | 38 | 3,000 | 5,412 | 80 | 3,749 | 6,442 | 72 |
| Hamilton | 423 | 220 | -48 | 5,436 | 204 | -96 | 5,859 | 424 | -93 |
| Kamloops | 59 | 153 | 159 | 24 | 96 | 300 | 83 | 249 | 200 |
| Kelowna | 135 | 396 | 193 | 36 | 4,116 | ## | 171 | 4,512 | ## |
| Kingston | 278 | 166 | -40 | 5,412 | 1,992 | -63 | 5,690 | 2,158 | -62 |
| Kitchener – Cambridge – Waterloo | 349 | 428 | 23 | 7,632 | 2,148 | -72 | 7,981 | 2,576 | -68 |
| Lethbridge | 269 | 375 | 39 | 48 | 1,236 | ## | 317 | 1,611 | 408 |
| London | 630 | 624 | -1 | 4,944 | 264 | -95 | 5,574 | 888 | -84 |
| Moncton | 283 | 412 | 46 | 3,252 | 96 | -97 | 3,535 | 508 | -86 |
| Montréal | 1,297 | 1,478 | 14 | 12,311 | 29,880 | 143 | 13,608 | 31,358 | 130 |
| Nanaimo | 111 | 66 | -41 | 648 | 0 | -100 | 759 | 66 | -91 |
| Oshawa | 458 | 193 | -58 | 48 | 0 | -100 | 506 | 193 | -62 |
| Ottawa – Gatineau | 2,691 | 2,358 | -12 | 7,476 | 8,220 | 10 | 10,167 | 10,578 | 4 |
| Gatineau | 512 | 265 | -48 | 2,184 | 3,720 | 70 | 2,696 | 3,985 | 48 |
| Ottawa | 2,179 | 2,093 | -4 | 5,292 | 4,500 | -15 | 7,471 | 6,593 | -12 |
| Peterborough | 59 | 164 | 178 | 0 | 0 | - | 59 | 164 | 178 |
| Québec | 230 | 781 | 240 | 1,740 | 5,856 | 237 | 1,970 | 6,637 | 237 |
| Red Deer | 76 | 208 | 174 | 60 | 144 | 140 | 136 | 352 | 159 |
| Regina | 243 | 208 | -14 | 984 | 1,152 | 17 | 1,227 | 1,360 | 11 |
| Saguenay | 561 | 425 | -24 | 1,224 | 576 | -53 | 1,785 | 1,001 | -44 |
| St. Catharines – Niagara | 384 | 475 | 24 | 288 | 996 | 246 | 672 | 1,471 | 119 |
| Saint John | 181 | 217 | 20 | 564 | 312 | -45 | 745 | 529 | -29 |
| St. John's | 436 | 478 | 10 | 348 | 264 | -24 | 784 | 742 | -5 |
| Saskatoon | 1,275 | 1,013 | -21 | 864 | 492 | -43 | 2,139 | 1,505 | -30 |
| Sherbrooke | 450 | 129 | -71 | 1,332 | 636 | -52 | 1,782 | 765 | -57 |
| Thunder Bay | 157 | 105 | -33 | 0 | 168 | ## | 157 | 273 | 74 |
| Toronto | 4,066 | 3,341 | -18 | 7,824 | 25,788 | 230 | 11,890 | 29,129 | 145 |
| Trois-Rivières | 181 | 154 | -15 | 1,536 | 480 | -69 | 1,717 | 634 | -63 |
| Vancouver | 2,239 | 2,596 | 16 | 26,808 | 22,392 | -16 | 29,047 | 24,988 | -14 |
| Victoria | 393 | 299 | -24 | 5,772 | 1,080 | -81 | 6,165 | 1,379 | -78 |
| Windsor | 649 | 286 | -56 | 684 | 372 | -46 | 1,333 | 658 | -51 |
| Winnipeg | 1,494 | 1,792 | 20 | 1,944 | 2,832 | 46 | 3,438 | 4,624 | 34 |
Data for 2022 based on 2016 Census Definitions and data for 2023, 2024 and 2025 based on 2021 Census Definitions.
Source: CMHC Starts and Completion Survey, Market Absorption Survey
## not calculable / extreme value
