Growth in mortgage debt accelerates as new mortgages for property purchases and refinances record substantial increases
We explore the growth in mortgage debt, surge in scheduled and non-scheduled payments, increase in mortgage originations and decrease in mortgage arrears. Find all the details in our winter 2021 Residential Mortgage Industry Dashboard.
Mortgage debt growth accelerated in 2020, partially mirroring the strong housing market activity in Canada. The stage was set for the observed increase in mortgage borrowing for both property purchases and refinancing by the:
- higher savings rate of households
- shifting housing needs
- record-low interest rates
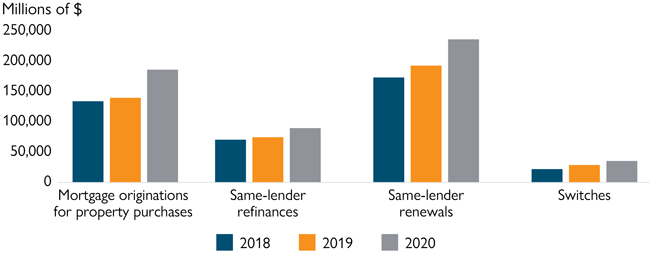
Chartered banks recorded a rise of 33% in new mortgages originated for property purchases at year end. They also recorded an increase of 20% in refinances compared to 2019 (see figure 1). This means banks added $305 billion worth of residential mortgages to their balance sheets.
During the same period, 9.8% of all renewals and refinances were conducted with a different financial institution than the previous one (see figure 1). This is called a “switch”.
The switch rate remained similar to that recorded for the same period in 2019. Record-low interest rates continued to stimulate the housing market and contributed to increased interest rate shopping by homeowners.
Figure 1: Mortgage Debt Growth (in Millions)

| Mortgage originations for property purchases | Same-lender refinances | Same-lender renewals | Switches | |
|---|---|---|---|---|
| 2018 | $131,531 | $69,349 | $170,000 | $20,853 |
| 2019 | $136,983 | $73,085 | $189,107 | $28,381 |
| 2020 | $182,790 | $88,040 | $231,491 | $34,753 |
Source: CMHC, residential mortgage data reporting of NHA MBS issuers, CMHC calculations
Both scheduled and non-scheduled payments on mortgage principal surge as most mortgage deferral agreements expire
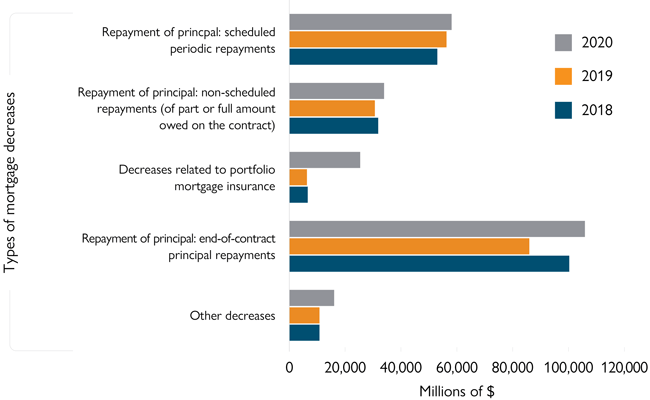
The majority of Canadians who were granted mortgage deferrals in 2020 resumed making payments in September and October. As a result, scheduled mortgage payments increased in the second half of 2020. In the last quarter of 2020, more than $16 billion in payments were made. Many mortgage borrowers made higher unscheduled mortgage payments in 2020 compared to the previous year through:
- lump-sum payments
- accelerated repayments
All in all, mortgage lenders recorded over $92 billion in mortgage payments in 2020. This is a 6% increase compared to 2019 (see figure 2).
Figure 2: Scheduled and Non-Scheduled Mortgage Repayments

| Other decreases | Repayment of principal: end-of-contract principal repayments | Decreases related to portfolio mortgage insurance | Repayment of principal: non-scheduled repayments (of part or full amount owed on the contract) | Repayment of principal: scheduled periodic repayments | |
|---|---|---|---|---|---|
| 2018 | $10,786 | $100,296 | $6,566 | $31,809 | $53,029 |
| 2019 | $10,779 | $85,936 | $6,347 | $30,654 | $56,317 |
| 2020 | $16,069 | $105,897 | $25,414 | $33,963 | $58,098 |
Source: CMHC, residential mortgage data reporting of NHA MBS issuers, CMHC calculations
Non-bank mortgage lenders also post record-high increases in mortgage originations
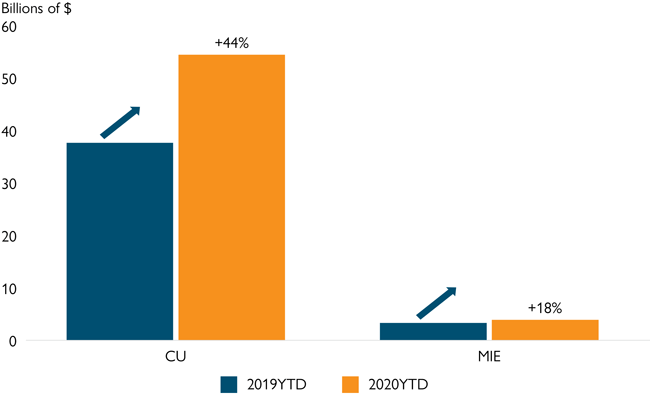
In the third quarter of 2020, credit unions had added $54 billion worth of new residential mortgages to their portfolio since the beginning of the year. This 44% increase over the same period in 2019 was driven by property purchases and were responsible for the highest increase in lending activity among non-bank lenders.
Mortgage investment entities also registered an increase in new mortgage activity. At 18%, their increase was lower than the rest of the non-bank industry (see figure 3).
Figure 3: Credit Unions and Mortgage Investment Entities Mortgage Activity During the First 3 Quarters of 2020

| 2019 Year-to-Date | 2020 Year-to-Date | |
|---|---|---|
| CU | 37.681608 | 54.43624 |
| MIE | 3.3141454 | 3.899717 |
Source: Statistics Canada, Survey of Non-Bank Mortgage Lenders, third quarter 2020, CMHC calculations
Mortgage arrears decrease slightly across all lender types
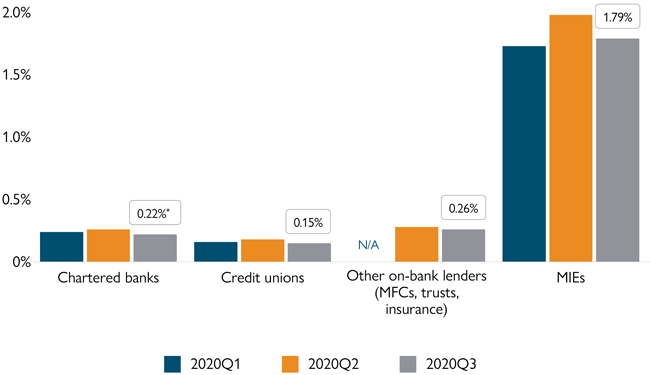
Mortgage arrears decreased in the third quarter of 2020 across all lender types to varying degrees (see figure 4). Consumers continued to make their mortgage payments on time or they were able to reach an agreement to defer their mortgage payments during that period.1
Even with the expiration of a large number of mortgage deferrals and the resumption of payments made by households, expected mortgage credit losses2 are more than $1.4 billion for banks. This is a significant increase — up from $790 million. This amount represents the value of mortgages that the financial institutions expect will go into default.
This increase partially reflects recent changes to financial reporting requirements. The 0.1% of mortgages held by banks reported as expected losses reflects the slight increase in early-stage delinquency rates (31 to 59 days and 60 to 89 days).
Figure 4: Mortgages in Arrears (Delinquent for 90 or More Days)

| Chartered banks | Credit unions | Other non-bank lenders (Mortgage Finance Companies, trusts, insurance) | Mortgage Investment Entities | |
|---|---|---|---|---|
| 2020 Q1 | 0.24% | 0.16% | N/A | 1.73% |
| 2020 Q2 | 0.26% | 0.18% | 0.28% | 1.98% |
| 2020 Q3 | 0.22% | 0.15% | 0.26% | 1.79% |
Source: Statistics Canada, Survey of Non-Bank Mortgage Lenders, third quarter 2020, and Canadian Bankers Association, * November 2020
Get new analysis and reports as soon as they are released, sign up to receive our Housing Research Newsletter.
Footnotes
- Deferred mortgages are not considered to have payments past due, since the lender agreed not to expect payments for a determined amount of time.
- Source: Statistics Canada, Mortgage Loans Report (ES), Table 36-10-0580-01, National Balance Sheets Accounts


 Share via Email
