Want a new view of Canadian residential mortgage lending? The Residential Mortgage Industry Data Dashboard is now available for your housing finance analysis. Users interested in mortgage industry data can arrange this information by:
- mortgage stocks
- arrears
- flow
- lender type
- insured status
The Residential Mortgage Industry Data Dashboard can help you and those in the housing market industry to better understand mortgage performance. You can use this data to make more informed risk-based decisions. This can contribute to a more stable and affordable housing market.
We created this dashboard to close a data gap. It provides a nationwide view of Canada’s residential mortgage industry.
Where does the data come from?
The data comes from OSFI — Office of the Superintendent of Financial Institutions — and Statistics Canada. They compile the data quarterly.
OSFI receives the data from federally regulated financial institutions. Statistic Canada collects the housing data from non-bank lenders with at least $100 million in mortgage assets. The data is grouped to respect confidentiality.
What does it look like?
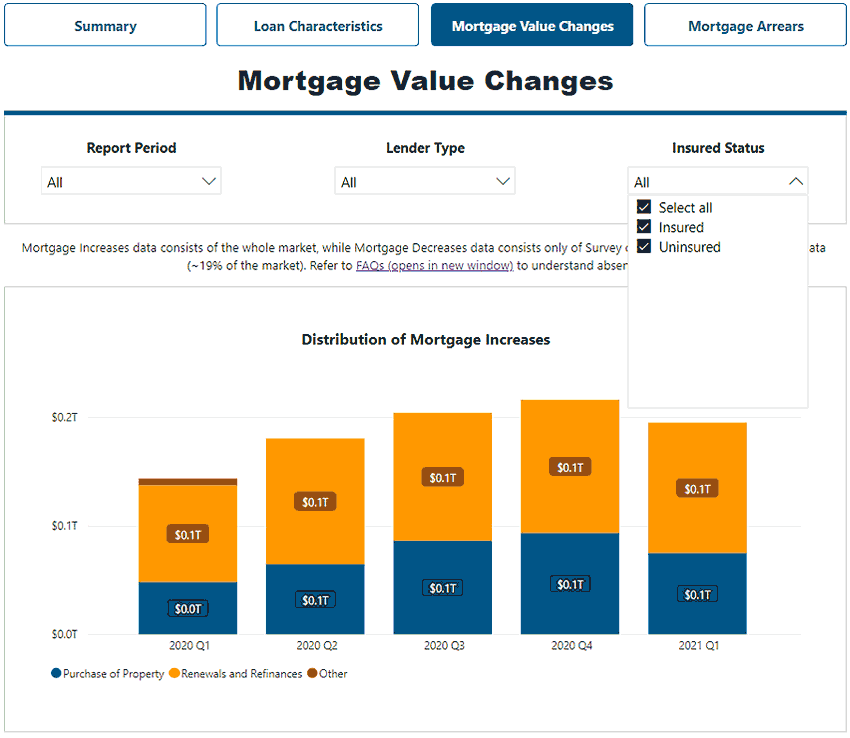
Here are some sample screenshots. The main view shows 4 tabs that you can select with 3 drop down options below.

Text version: The dashboard has four tabs across the top you can select: summary, loan characteristics, mortgage value changes and mortgage arrears. Within, there are 3 options each with dropdowns. The options are: report period, lender type and insured status.
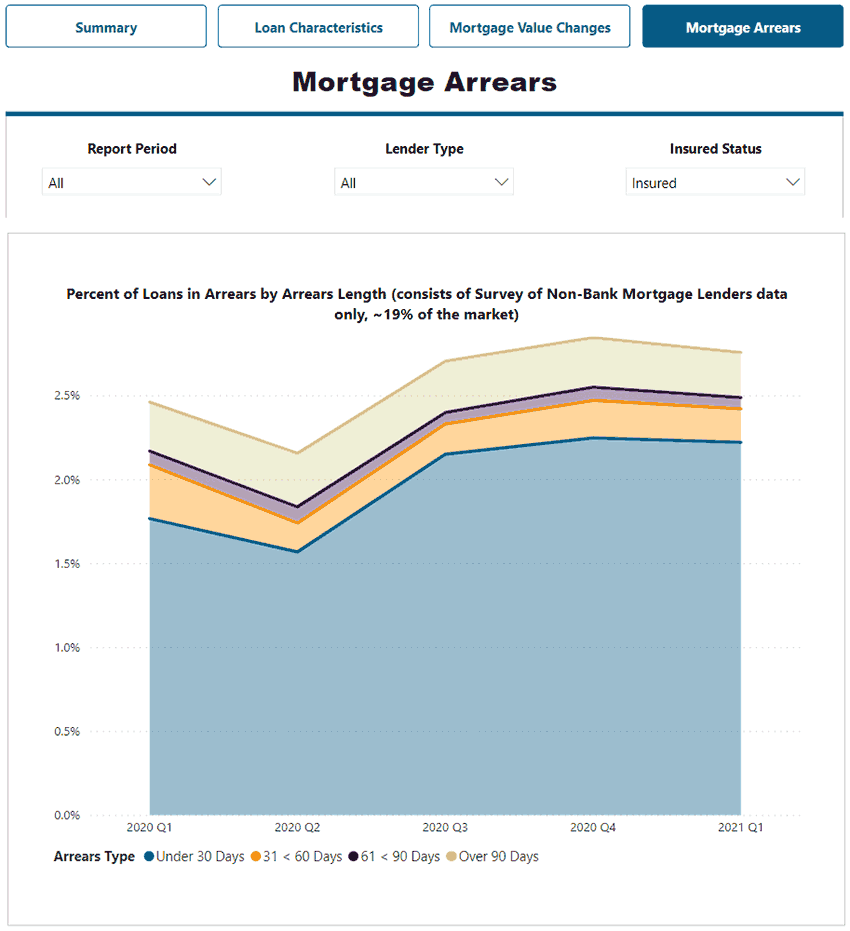
The image below shows an area graph focussing on arrears for a one year period. This graph shows mortgage arrears by
- less than 30 days
- 30 to less than 60 days
- 71 to less than 90 days
- over 90 days

Text version: This graph shows mortgage arrears by less than 30 days, 30 to less than 60 days, 71 to less than 90 days and over 90 days. Trends appear across each quarter of data.
If you started here with the dashboard and would like to gain some insights on the data, download the 2021 Residential Mortgage Industry Report.


 Share via Email
