We have just released the results of the new 2020 Condominium Apartment Survey. In these annual tables, we share information on non-resident ownership of condominium apartments.
The results show the years from 2016 to 2020.
Highlights
- The share of non-resident-owned1 condominium apartment units was in the low, single-digits in most of Canada’s largest centres.
- Cities with shares above 1% in 2020 include:
- Vancouver
- Toronto
- Ottawa
- Gatineau
- Montreal
- Shares are significantly higher in central surveyed sub-areas:
- Montreal’s Downtown and Nun’s Island area
- Toronto Centre
- Vancouver’s Burrard Peninsula
- Non-resident condominium apartment ownership tends to concentrate in newer and larger buildings, particularly in:
- Vancouver
- Toronto
- Montréal
- Non-ownership shares largely held steady in 2020 compared to 2019. Most centres saw no significant changes or reported small changes.
Related work from Statistics Canada also reports comparably low shares of non-resident ownership for cities surveyed in 2019. Statistics Canada finds that non-resident owners tend not to be owner-occupants. Non-residents own 15 to 20% of non-occupied units in Toronto and Vancouver.
This suggests that non-resident ownership is concentrated in the secondary rental market. CMHC and Statistics Canada results combined suggest that in the secondary rental market, non-resident ownership is likely concentrated in newer and larger rental buildings. These buildings generally command higher market rents.4
The share of non-resident ownership in condominium apartments remains low and stable
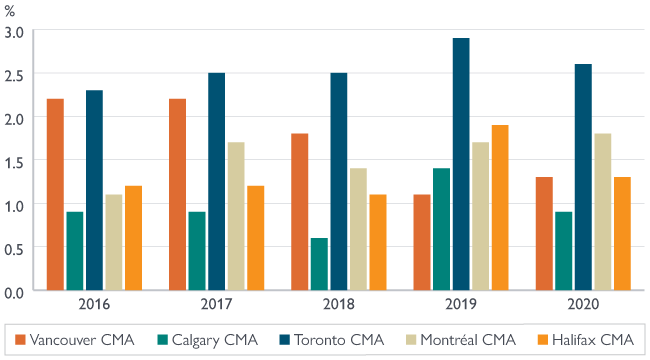
Results indicate that non-resident ownership shares of the total stock of condominium apartments remained low. The 17 surveyed census metropolitan areas2 showed estimates with the majority of centres reporting shares of less than 1%. The only Census Metropolitan Areas (CMAs) with non-resident shares above 1% reported low shares nonetheless, including:
- Toronto (2.6%)
- Montréal (1.8%)
- Vancouver (1.3%)
- Halifax (1.3%)
Figure 1: The share of non-resident ownership of condominium apartments remains low in major centres
| 2016 | 2017 | 2018 | 2019 | 2020 | |
|---|---|---|---|---|---|
| Vancouver CMA | 2.2 | 2.2 | 1.8 | 1.1 | 1.3 |
| Calgary CMA | 0.9 | 0.9 | 0.6 | 1.4 | 0.9 |
| Toronto CMA | 2.3 | 2.5 | 2.5 | 2.9 | 2.6 |
| Montréal CMA | 1.1 | 1.7 | 1.4 | 1.7 | 1.8 |
| Halifax CMA | 1.2 | 1.2 | 1.1 | 1.9 | 1.3 |
Source: CMHC Condominium Apartment Survey
Non-resident ownership shares were stable in most surveyed centres. Nine of the 17 surveyed areas saw no statistically significant change from 2019. The remaining centres saw small, if significant, percentage point changes (See Table 1 in the CAS non-resident ownership data tables)3.
Non-resident ownership shares remain highest in the central sub-areas of Vancouver, Toronto and Montréal
Our survey collects additional information for sub-areas of:
- Vancouver
- Toronto
- Montréal
In all 3 CMAs, central sub-areas continued to show significantly higher shares of non-resident ownership than other surveyed areas in 2020:
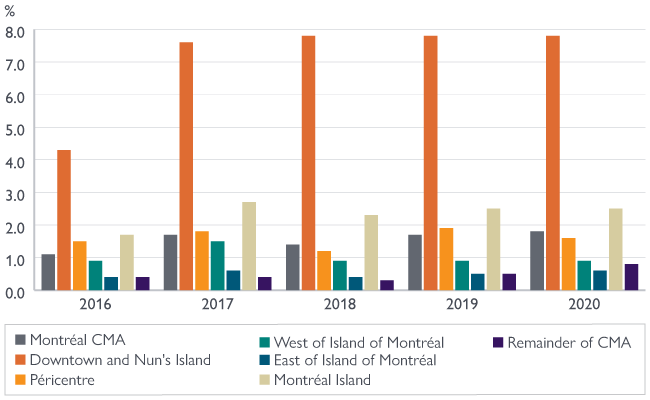
- In Montréal, the Downtown and Nun’s Island area (7.8%) reported the highest share across all surveyed centres.
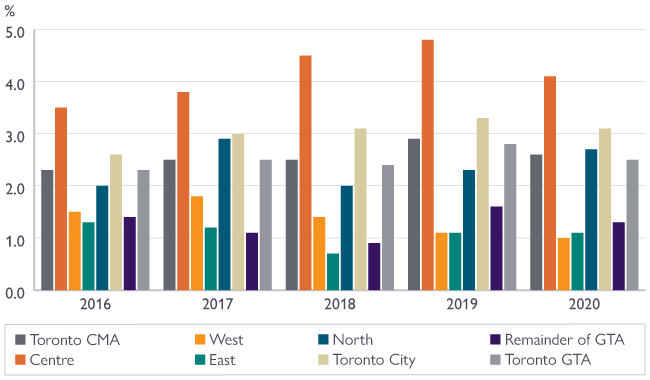
- Toronto Centre (4.1%) and Toronto City (3.1%) reported the next highest shares.
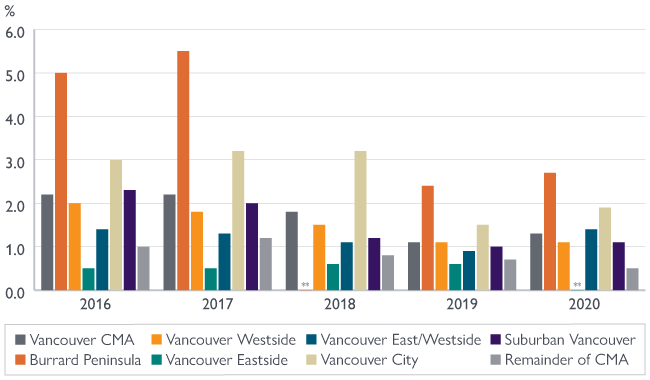
- This was followed by Toronto North and Vancouver’s Burrard Peninsula (both at 2.7%) and Montréal Island (2.5%) (See Table 1 in the CAS non-resident ownership data tables).
Figure 2: The share of non-resident ownership of condominium apartments in Montreal remains low outside of Downtown and Nun's Island
| 2016 | 2017 | 2018 | 2019 | 2020 | |
|---|---|---|---|---|---|
| Montréal CMA | 1.1 | 1.7 | 1.4 | 1.7 | 1.8 |
| Downtown and Nun's Island | 4.3 | 7.6 | 7.8 | 7.8 | 7.8 |
| Péricentre | 1.5 | 1.8 | 1.2 | 1.9 | 1.6 |
| West of Island of Montréal | 0.9 | 1.5 | 0.9 | 0.9 | 0.9 |
| East of Island of Montréal | 0.4 | 0.6 | 0.4 | 0.5 | 0.6 |
| Montréal Island | 1.7 | 2.7 | 2.3 | 2.5 | 2.5 |
| Remainder of CMA | 0.4 | 0.4 | 0.3 | 0.5 | 0.8 |
Source: CMHC Condominium Apartment Survey
Figure 3: The share of non-resident ownership of condominium apartments remains low in Toronto CMA
| 2016 | 2017 | 2018 | 2019 | 2020 | |
|---|---|---|---|---|---|
| Toronto CMA | 2.3 | 2.5 | 2.5 | 2.9 | 2.6 |
| Centre | 3.5 | 3.8 | 4.5 | 4.8 | 4.1 |
| West | 1.5 | 1.8 | 1.4 | 1.1 | 1.0 |
| East | 1.3 | 1.2 | 0.7 | 1.1 | 1.1 |
| North | 2.0 | 2.9 | 2.0 | 2.3 | 2.7 |
| Toronto City | 2.6 | 3.0 | 3.1 | 3.3 | 3.1 |
| Remainder of GTA | 1.4 | 1.1 | 0.9 | 1.6 | 1.3 |
| Toronto GTA | 2.3 | 2.5 | 2.4 | 2.8 | 2.5 |
Source: CMHC Condominium Apartment Survey
Figure 4: The share of non-resident ownership of condominium apartments remains low and stable since declining from 2016 – 2017 levels, including Burrard Peninsula
| 2016 | 2017 | 2018 | 2019 | 2020 | |
|---|---|---|---|---|---|
| Vancouver CMA | 2.2 | 2.2 | 1.8 | 1.1 | 1.3 |
| Burrard Peninsula | 5.0 | 5.5 | ** | 2.4 | 2.7 |
| Vancouver Westside | 2.0 | 1.8 | 1.5 | 1.1 | 1.1 |
| Vancouver Eastside | 0.5 | 0.5 | 0.6 | 0.6 | ** |
| Vancouver East/Westside | 1.4 | 1.3 | 1.1 | 0.9 | 1.4 |
| Vancouver City | 3.0 | 3.2 | 3.2 | 1.5 | 1.9 |
| Suburban Vancouver | 2.3 | 2.0 | 1.2 | 1.0 | 1.1 |
| Remainder of CMA | 1.0 | 1.2 | 0.8 | 0.7 | 0.5 |
Source: CMHC Condominium Apartment Survey
Note: ** Data suppressed to protect confidentiality or data not statistically reliable.
Non-resident ownership of condominium apartments tends to be highest in newer and larger buildings, particularly in Vancouver, Toronto and Montréal
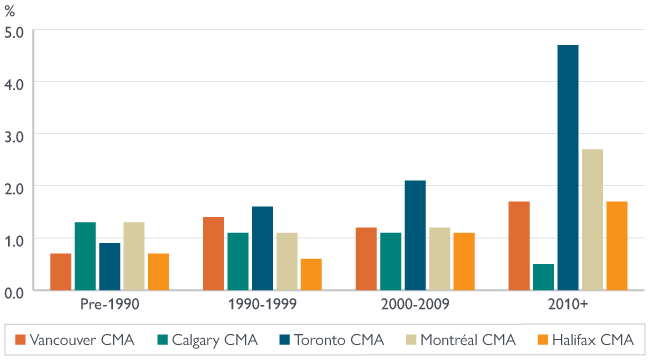
Non-resident ownership shares continue to be highest for condominium apartments completed since 2010 in most surveyed centres. This is lead in 2020 by:
- Toronto (4.7%)
- Montreal (2.7%)
- Vancouver (1.7%)
- Halifax (1.7%)
Additional data was collected by age of structures in Toronto and Vancouver. Results show higher shares in surveyed sub-areas in the centres, led by the sub-area of Toronto Centre at 6.0% in 2020 (See Table 2 in the CAS non-resident ownership data table package).
Markets in the prairies tend to show a different trend (See Table 3 in the CAS non-resident ownership data tables). Non-resident ownership shares are highest for units in structures completed before 1990 in:
- Calgary
- Saskatoon
- Regina
Figure 5: The share of non-resident ownership is highest for newer condominium apartments in Vancouver, Toronto and Montreal and Halifax
| Vancouver CMA | Calgary CMA | Toronto CMA | Montréal CMA | Halifax CMA | |
|---|---|---|---|---|---|
| Unknown | ** | 0.6 | ** | 0.9 | ** |
| Pre-1990 | 0.7 | 1.3 | 0.9 | 1.3 | 0.7 |
| 1990 – 1999 | 1.4 | 1.1 | 1.6 | 1.1 | 0.6 |
| 2000 – 2009 | 1.2 | 1.1 | 2.1 | 1.2 | 1.1 |
| 2010+ | 1.7 | 0.5 | 4.7 | 2.7 | 1.7 |
| Total | 1.3 | 0.9 | 2.6 | 1.8 | 1.3 |
Source: CMHC Condominium Apartment Survey
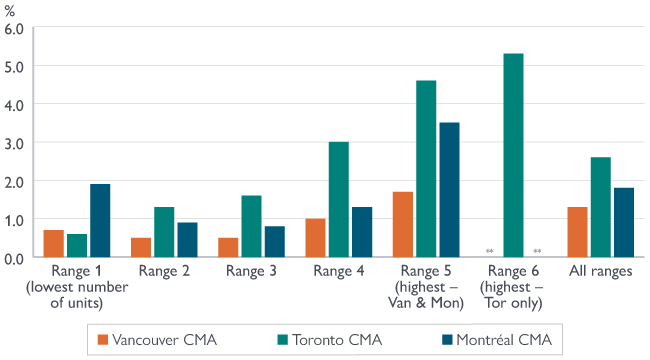
Non-resident owners also showed a clear preference for condominium apartments in larger buildings. We measured by the number of units in the building in:
- Toronto
- Vancouver
- Montréal
In the CMA of Toronto, structures in the largest segment registered a non-resident ownership share of 5.3% compared to the share of all-range share of 2.6%. In the CMA of Montréal, the share was 3.5% in the largest structures vs. the overall share of 1.8%.The CMA of Vancouver registered a largest-structures share of 1.7% vs the overall share of 1.3% (See Table 4 in the CAS non-resident ownership data tables). The share of non-resident ownership by size of structure outside of these centres was generally not as concentrated in any particular age-range (See Table 5 in the CAS non-resident ownership data tables).
Figure 6: The share of non-resident ownership of condominium apartments is highest for the largest structures (with the highest number of units) in Vancouver, Toronto and Montréal
| Vancouver CMA | Toronto CMA | Montréal CMA | |
|---|---|---|---|
| Range 1 (lowest number of units) | 0.7 | 0.6 | 1.9 |
| Range 2 | 0.5 | 1.3 | 0.9 |
| Range 3 | 0.5 | 1.6 | 0.8 |
| Range 4 | 1.0 | 3.0 | 1.3 |
| Range 5 (highest — Van & Mon) | 1.7 | 4.6 | 3.5 |
| Range 6 (highest — Tor only) | 5.3 | ||
| All ranges | 1.3 | 2.6 | 1.8 |
Source: CMHC Condominium Apartment Survey
Newer condominium units will tend to command a higher market price than older units. Larger buildings tend to provide additional amenities than smaller buildings. Amenities include:
- underground parking lots
- swimming pools
- gyms
This implies that condominium units in larger buildings would also tend to command a higher price than units in smaller buildings.
Related work from Statistics Canada also reports roughly comparably low shares of non-resident ownership for cities surveyed in 2019. The shares stood at:
- 2.6% for Toronto
- 5.0% for Vancouver
- 2.1% for Halifax
Statistics Canada finds that non-resident owners tend not to be owner-occupants. Over 98% of non-residents own condominiums they did not occupy.
The Statistics Canada data also indicates that non-residents own 15% of non-occupied units in Toronto. Vancouver saw 20% of non-occupied units in Vancouver. This suggests that non-resident ownership is concentrated in the secondary rental market. These units mainly consist of condominium owners who rent out their properties in these cities. Both CMHC and Statistics Canada’s results suggest that within the secondary rental market, non-resident ownership is likely concentrated in newer and larger rental buildings that generally command higher market rents.
Download the Condo Apartment Survey Data Tables
CMHC and Statistics Canada produce complementary data on estimates of foreign ownership in residential real estate
The Condominium Apartment Survey launched in 2014 to address the data gap on the share of foreign ownership in Canadian residential real estate. We have produced estimates for major centres from 2014 to 2020.
In Budget 2017, the Government of Canada provided funding to Statistics Canada to improve housing data. This went to the Canadian Housing Statistics Program (CHSP). Among other data, Statistics Canada has since published estimates from the CHSP focusing on non-resident ownership for several centres and provinces. This includes these census metropolitan areas also covered by the Condominium Apartment Survey:
- Vancouver
- Toronto
- Halifax
Foreign ownership defined
CMHC and Statistics Canada both define a non-resident homeowner as an individual whose principal residence is outside of Canada. This is often expressed as a “foreign homeowner”. “Foreign ownership”, in this case, technically refers to the non-Canadian residency of the legal owner of the property, irrespective of the owner’s nationality. This definition would classify Canadian citizens whose primary residence is outside of Canada as “non-resident”.
Data gathering approach
Statistics Canada’s approach is more comprehensive than ours in gathering data on non-resident ownership in Canadian housing markets5. As a result, differences in the estimates can occur. For example, the share of non-resident condominium apartment ownership in Toronto and Vancouver differed in 2017.
As a result, both data from Statistics Canada and CMHC should be consulted. Point-estimates for these census metropolitan areas (and their sub-areas) should be taken from Statistics Canada’s results, reflecting their comprehensive methodology.
Our time series of estimates for Toronto and Vancouver can be relied upon. These estimates give insight into the general trends in non-resident ownership since 2014 and allow for comparison between cities.
Get new analysis and reports as soon as they are released, sign up to receive our Housing Research Newsletter.
Footnotes
- Foreign ownership is defined as individuals whose primary residence is outside Canada (i.e. non-resident owners).
- The 17 surveyed Census Metropolitan Areas include: Vancouver, Victoria, Kelowna, Calgary, Edmonton, Saskatoon, Regina, Winnipeg, London, Kitchener-Cambridge-Waterloo, Hamilton, Toronto, Ottawa, Gatineau, Montréal, Quebec and Halifax.
- If a change is not statistically significant, the survey cannot determine if the non-resident ownership share is higher or lower this year relative to the previous year, when considering the survey margin of error.
- See Statistics Canada, Table 46-10-0029-01: Property use of residential properties, by property type and residency ownership.
- See our report Non-Resident Ownership of Condominium Apartments, Housing Market Insight, December 2017 (PDF) by Gustavo Durango. It provides a full discussion of the methodological differences between Statistics Canada’s and CMHC’s estimates.


 Share via Email
