At the time of our 2020 Housing Market Outlook report, there was extreme uncertainty about how the pandemic and economic consequences would evolve. Existing home sales and prices have generally exceeded pre-COVID levels and CMHC’s forecast range over the pandemic. The housing market has performed strongly despite measures that limited economic activity in order to manage the on-going pandemic.
Our latest Housing Market Insight explores housing trends in major markets since March 2020, when the global pandemic was declared. Our analysis is based on existing home sales and price trends in Vancouver, Calgary, Edmonton, Toronto, Ottawa and Montreal. This report examines factors that led to differences between forecasts and actual housing market activity, with a focus on home sales and prices.
Here are some of the key highlights from the report:
There was a sharp decline in sales and prices in the second quarter of 2020 from elevated pre-pandemic levels. This was due, in part, to public health restrictions, to avoid infection, that were in place during this time.
By the end of the third quarter, home sales and average prices recovered beyond pre-pandemic levels, exceeding almost all forecasts. The unexpectedly high level of housing market activity observed so far during the pandemic likely reflects:
- Pent-up demand in the second quarter due to lockdown restrictions. As restrictions were lifted, this delayed demand accounted for a large share of the increase in third-quarter sales.
- Lower household spending increased the household savings rate to historic levels in the second and third quarters of 2020. Higher savings combined with lower mortgage interest rates appears to have encouraged some households to fund home purchases. Total sales outpaced total new listings as the existing home market recovered, supporting overall price growth. The mortgage deferral program may have delayed the need for some households to sell their home. Listings were likely held back in cases where households were not able to service their mortgage.
- Sales growth was stronger for more expensive housing in Vancouver, Toronto, Ottawa and Montreal. This further supports the price gains in these markets. Growth in the higher-priced market also reflects inequities in the economic impacts of the pandemic.
- Higher-income households quickly adjusted to the pandemic. They were able to maintain their income, benefit from historic household savings and low mortgage interest rates. These factors helped to keep this part of the population optimistic about purchasing a home. In contrast, those employed in lower-paid industries were less able to adapt to pandemic conditions. Combined with a sharp decline in new migrants to Canada, this resulted in decreased demand for less expensive housing types.
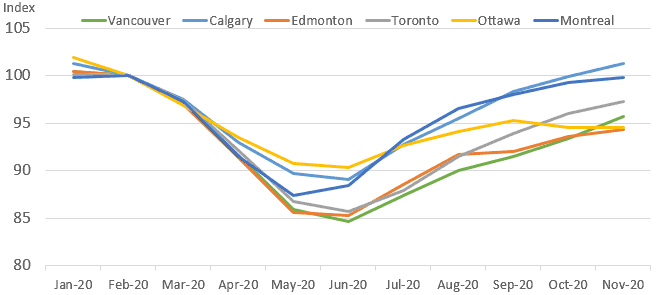
There are regional variations in employment recovery, as Calgary and Montreal were back up to pre-COVID levels by November 2020. However, most other markets remained below (Figure 1).
Figure 1: Employment index (Feb 2000=100)

| Jan-20 | Feb-20 | Mar-20 | Apr-20 | May-20 | Jun-20 | Jul-20 | Aug-20 | Sep-20 | Oct-20 | Nov-20 |
|---|---|---|---|---|---|---|---|---|---|---|
| 100.4 | 100.0 | 97.3 | 91.6 | 85.9 | 84.6 | 87.3 | 90.0 | 91.5 | 93.4 | 95.7 |
| 101.3 | 100.0 | 97.5 | 92.9 | 89.7 | 89.0 | 92.7 | 95.5 | 98.3 | 99.9 | 101.3 |
| 100.4 | 100.0 | 96.9 | 91.4 | 85.6 | 85.2 | 88.5 | 91.7 | 92.0 | 93.6 | 94.4 |
| 100.1 | 100.0 | 97.3 | 92.1 | 86.7 | 85.7 | 87.9 | 91.5 | 93.9 | 96.0 | 97.3 |
| 101.9 | 100.0 | 96.8 | 93.5 | 90.8 | 90.3 | 92.6 | 94.1 | 95.3 | 94.5 | 94.5 |
| 99.8 | 100.0 | 97.3 | 91.5 | 87.4 | 88.4 | 93.3 | 96.5 | 98.0 | 99.3 | 99.8 |
Source: Statistics Canada, Table 14-10-0097-01, 3-month moving average, unadjusted for seasonality. Calculations by CMHC.
We do remain concerned about major risks. Employment remains below pre-COVID levels in many places and government financial support programs are temporary. A complete and sustained recovery continues to depend on the uncertain course of the pandemic.


 Share via Email
